North Boulder's average home price climbed 12.6 percent year over year. Over the three months ending May 2026, the median sale price in the same area fell 3.3 percent from the year before. Both figures come from the same data provider, covering the same streets, pulled from the same neighborhood page. A buyer scrolling portal data trying to decide whether North Boulder is heating up or cooling off will find a real answer buried in neither number. The answer is sitting on a stretch of Violet Avenue, in a 37-home community that is quietly doing most of the statistical work for the entire pocket.
A Small Neighborhood with a Small Listing Pool
Wonderland Lake is not a big place. One data provider's boundary for the neighborhood puts the population at roughly 775 people, and its most recent count of townhouses on the market there sits at exactly ten. When a portal reports a median listing price for that slice of North Boulder, it is based on a smaller pool of listings than a citywide figure. That means one active project can have more influence on the median listing price.
That matters because "North Boulder" and "Wonderland Lake" are drawn as two different boundaries by the same data providers, one broad and one narrow, both centered on the same few blocks near the lake and Broadway. A homebuyer comparing the two can end up comparing a wide citywide trend line against a number that is really tracking one builder's remaining unsold inventory.
The 37 Homes on Violet Avenue
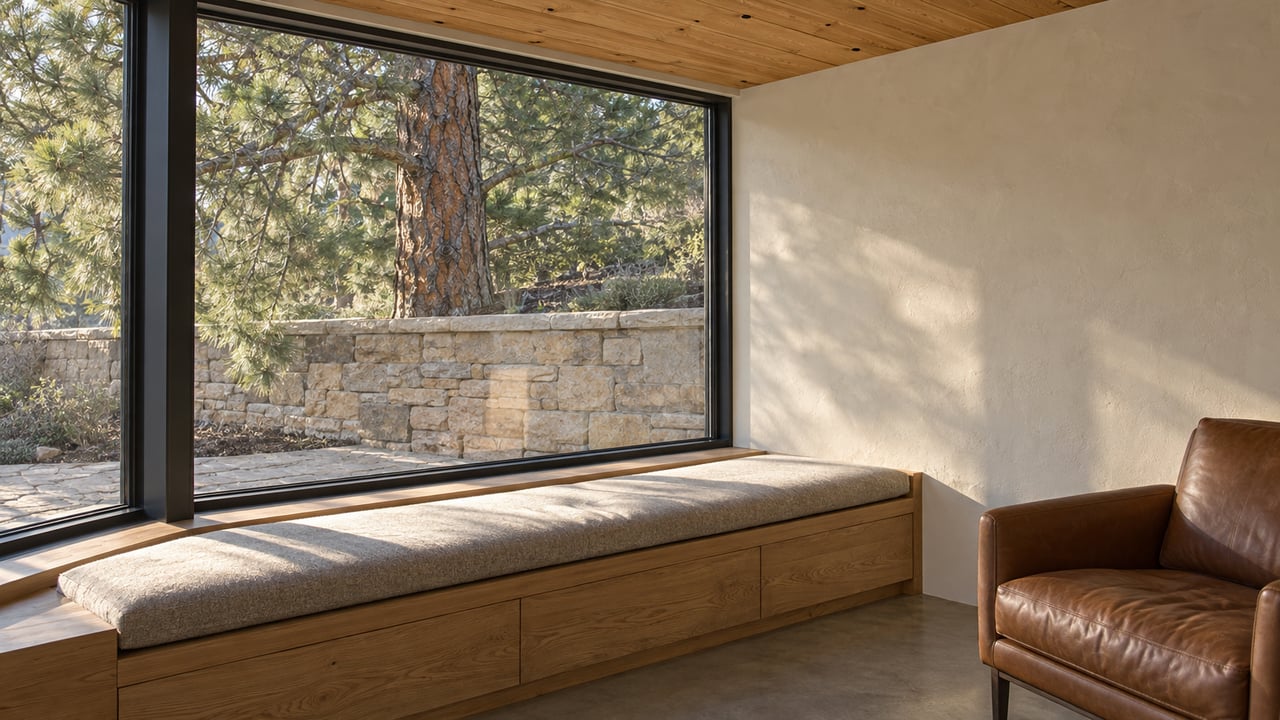
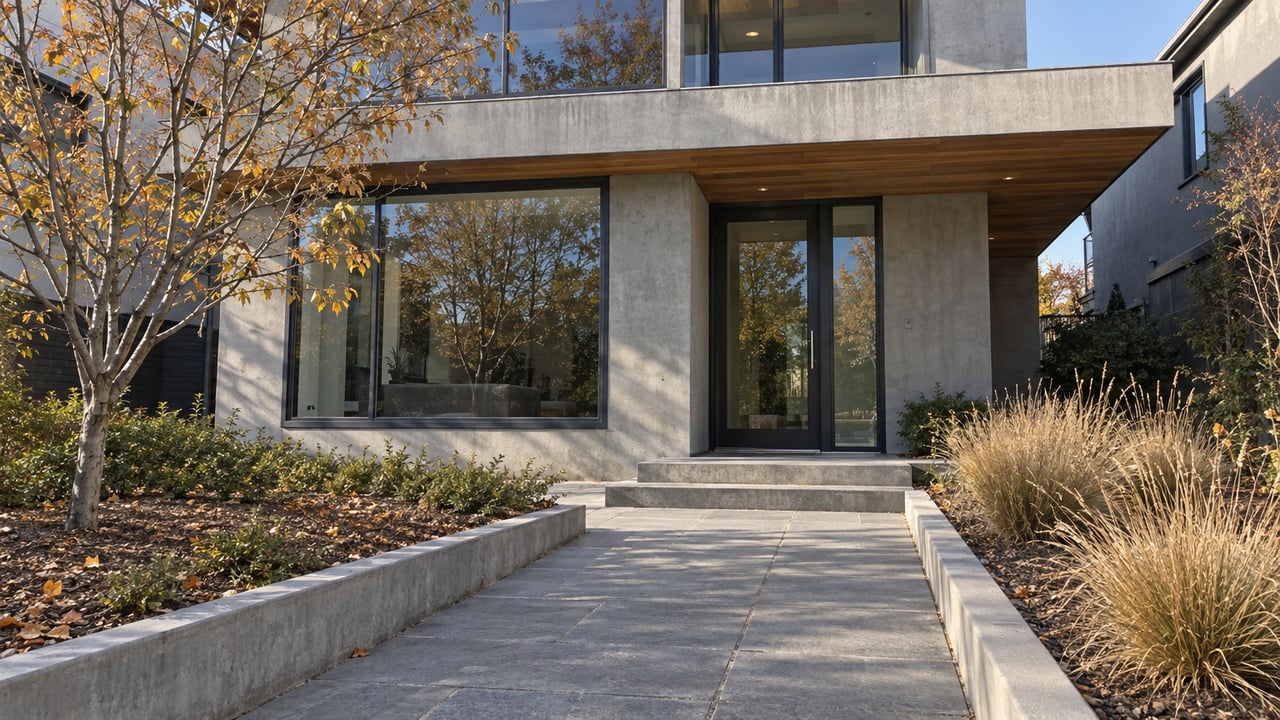
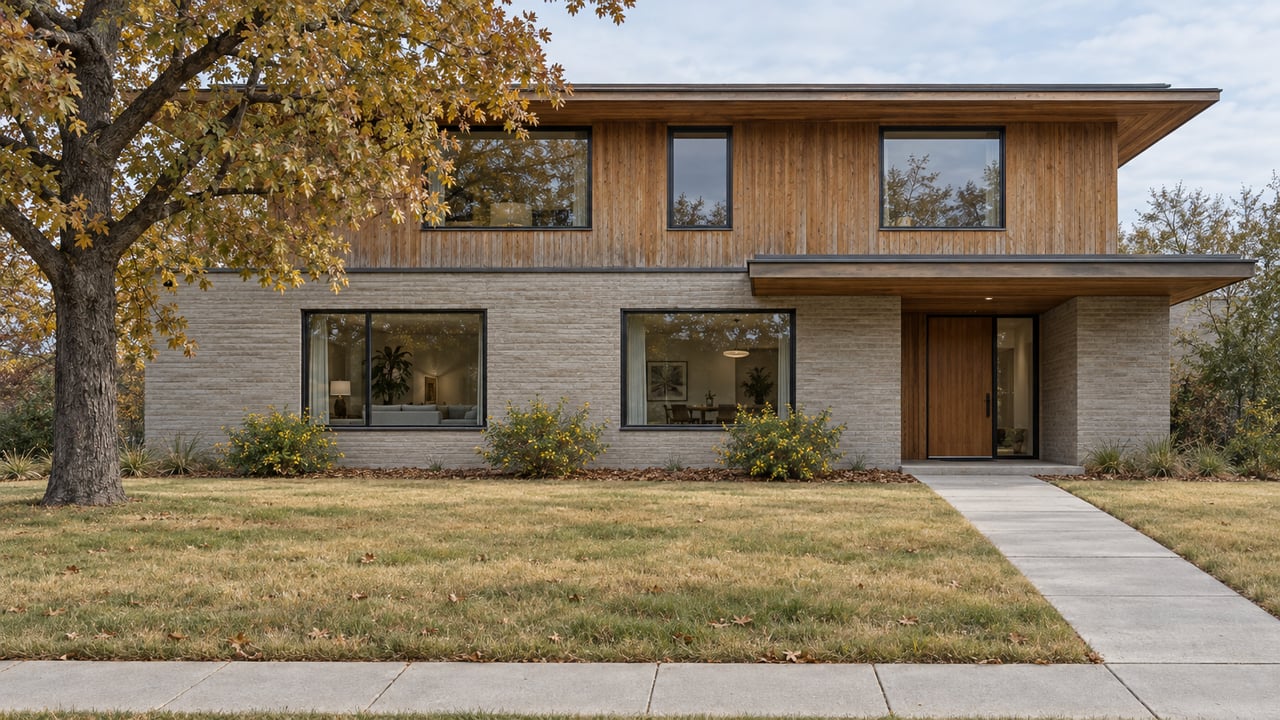
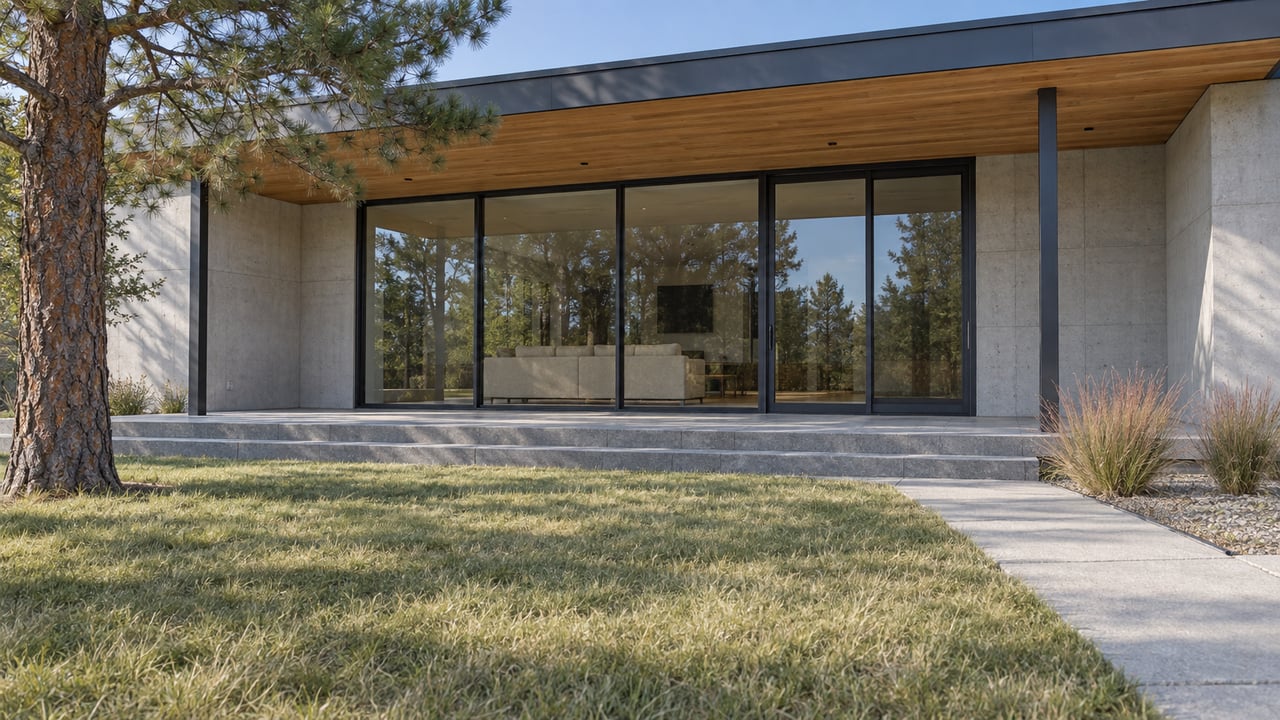
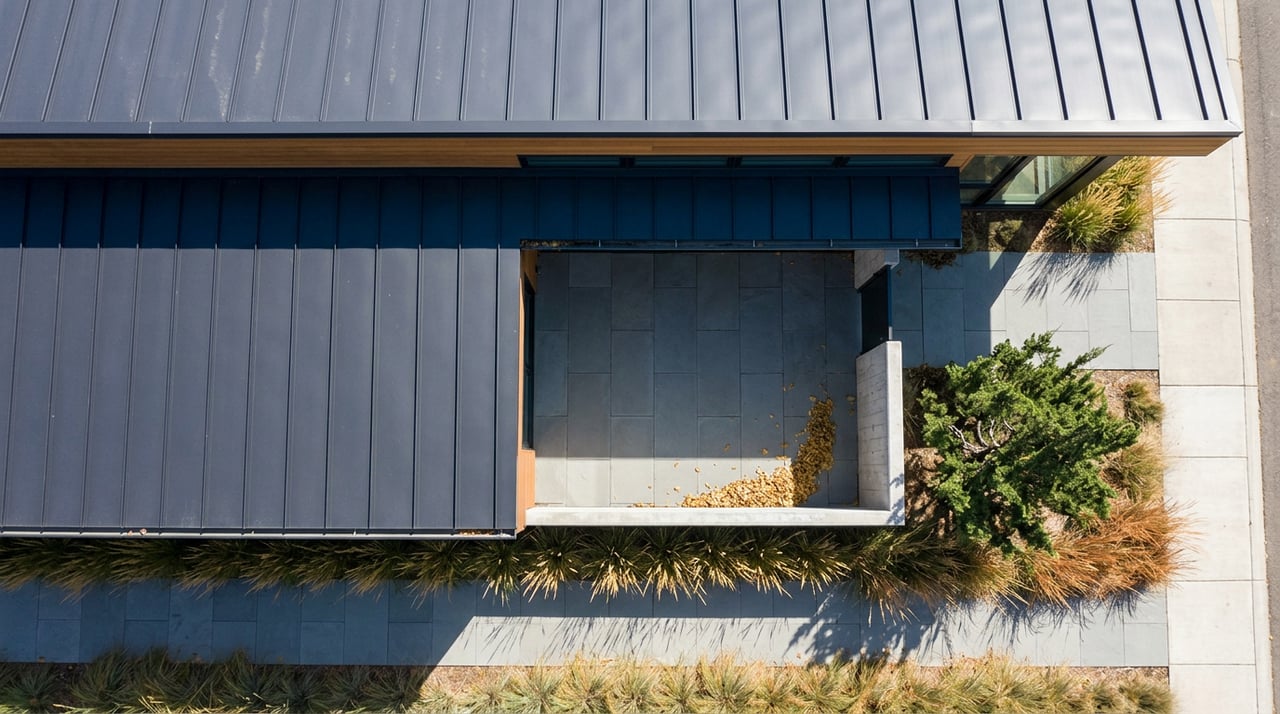
That builder is Koelbel and Company, a Colorado, family-owned firm with more than 70 years in business, and the project is called Violla. It was introduced in February 2025 as an enclave of 37 new homes bordered by Violet Avenue to the north and Union Avenue to the south, tucked against Wonderland Lake Park in North Boulder. The plan called for seven townhome floorplans ranging from 1,960 to 2,246 square feet, with options for dual primary suites, dedicated garages, and treetop decks looking toward the Flatirons, alongside three detached single-family floorplans that were expected to start construction in the summer of 2025 with pricing estimated in the low three-million range.
The community is exclusively listed by Kim Payes of The Agency, with a sales center at 1150 Locust Avenue. That detail matters for anyone trying to trace where these listings show up in public data. A development this size, marketed by a single listing team, produces a cluster of nearly identical comps that can look, from the outside, like organic neighborhood activity.
What the List Prices Are Actually Doing
Here is where the timeline gets interesting for anyone trying to read the market. In April 2026, Violla's published starting price sat at $1,580,000, with an end-unit floorplan called the Eldorado listed at $1,687,148 for 1,967 square feet. By June, the community had thinned to nine remaining homes, including two move-in ready units, spanning 1,960 to 4,339 square feet and priced from $1,640,023 up to $3,628,618, with an HOA fee of $4,200 a year. Koelbel's own marketing that same spring advertised move-in ready homes with up to $35,000 in incentives. Then, as of a September 9, 2026 MLS snapshot, one specific unit, a Sanitas Plan townhome at Violla, had been repositioned at $1,595,000.
That is not a straight line down. The figures show individual unit prices changing alongside advertised incentives during the project's remaining sales period. Roughly three quarters of the original 37 homes had already sold by mid-2026, which tells you Violla found real demand early. What is left is the classic tail end of a new-construction absorption curve, and tail ends do not price like a stable resale market. That context matters when considering how a small batch of remaining listings can show up in neighborhood-level figures.
Why This Skews the Whole Area's Numbers
Now put that alongside the North Boulder figures from earlier. Average house price up 12.6 percent year over year. Median sale price down 3.3 percent over the three months ending May 2026. Median price per square foot up 17.7 percent year over year to $555. Three numbers that would contradict each other in a normal, deep market start to make sense once you know a compact batch of new-construction townhomes priced above $800 per square foot has been closing in the same stretch as a wider mix of older, larger, post-war North Boulder homes.
A handful of small-footprint, high-dollar-per-square-foot sales can influence the median price per square foot without moving the overall sale-price median as much, because the two measures compare different things: sale price per square foot and the midpoint of transaction prices. That is exactly the shape you would expect if a 37-home luxury enclave is selling out its final units at the same time as a broader mix of everyday North Boulder resales continues at its own pace. Neither number is wrong. Neither number is describing the whole picture on its own.
How to Actually Read the Comps
For a buyer or seller trying to use these figures to make a decision, the practical move is to split the question in two before trusting a single headline number.
First, ask whether the listing you are comparing yourself against is new construction or resale. A Violla townhome at $1,595,000 to $1,687,000 is not a comp for a 1970s Wonderland Lake ranch two streets over, even though a portal might quietly fold both into the same neighborhood median. New construction carries a builder premium for finishes, warranty, and the flexibility to build a floorplan from scratch. Resale carries its own value in lot size, mature landscaping, and, in many cases, more square footage per dollar.
Second, look at the timeline behind any stat you're handed. A median that covers the last three months in a ten-listing neighborhood is going to move differently than a median covering the last three months across hundreds of sales citywide. Ask what window the number covers and how many transactions sit behind it before treating it as a signal about where prices are headed.
For sellers of older homes near Wonderland Lake Park, this cuts both ways. A headline median inflated by Violla's pricing can create buyer expectations that a resale home cannot match on finishes or warranty, but it can also anchor a buyer's sense of what "North Boulder new construction" costs, which makes a well-presented resale property look like relative value by comparison. Either way, the number on the portal is a starting point for a conversation, not a verdict.
A Short FAQ
Does Violla's pricing activity mean Wonderland Lake home values are falling? Not on its own. The listings show price changes and advertised incentives among the remaining homes. It is a separate question from what surrounding resale homes are actually trading for.
How should I compare a Violla townhome to an older home nearby? Look past the headline price to what it includes. New construction at Violla comes with current finishes, a builder warranty, and floorplans built for how people live now. An older Wonderland Lake home may offer more land, more established trees, or more total square footage for the price. Neither is a straight substitute for the other.
Why do North Boulder and Wonderland Lake show such different numbers on the same portal? Because they are drawn as different geographic boundaries. North Boulder is the wider slice, Wonderland Lake is the narrower one nested inside it, and a small development like Violla can carry disproportionate weight in the smaller boundary simply because there are so few other active listings to balance it out.
If you are comparing North Boulder pockets against each other, or trying to figure out what a specific home near Wonderland Lake is actually worth against both new construction and resale comps, that is exactly the kind of read where a local eye on the underlying inventory matters more than the headline number. Marybeth Emerson works this market block by block and can walk you through what the current numbers are really measuring before you make a decision. Schedule a consultation to talk through your specific comparison.